A lot of people seem not to understand very well what real-time means. They usually tend to think RT has anything to do with performance and the raw throughput. It doesn’t. It’s all about determinism and guarantees.
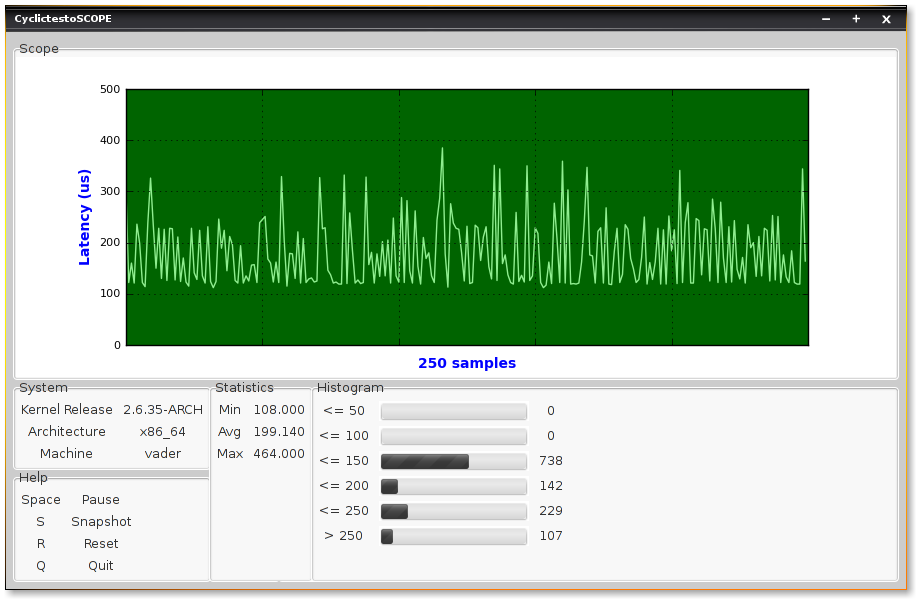
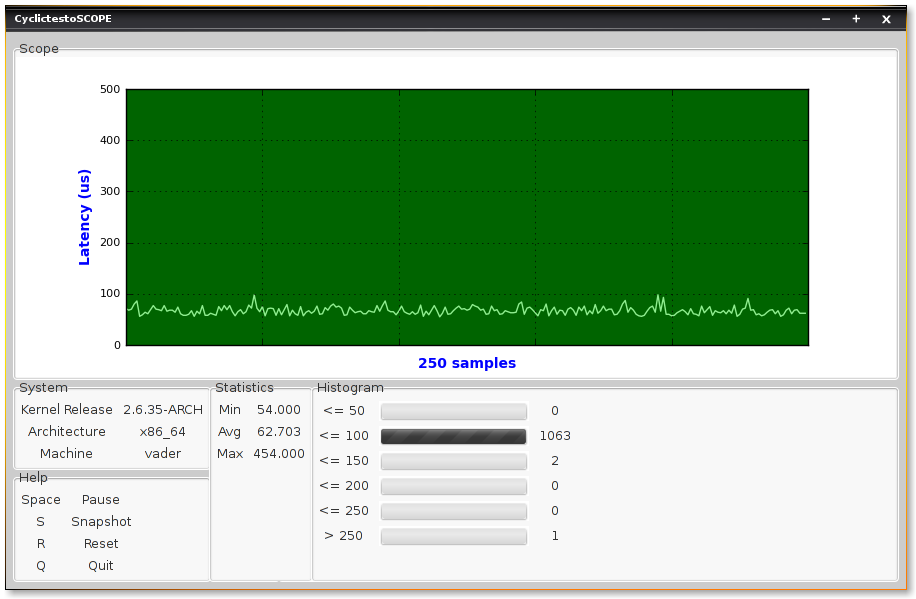
This post’s title has “by graphics” words. I think the graphics below are worth a thousand words. I obtained them while porting the RT tree to Freescale boards some weeks ago at ProFUSION. Basically I’m running a task that wakes up every 40ms, run a tiny job, send some numbers through the network and sleeps again. The time in the graphics is the difference between the total time (sleep + wake-up + execution) and 40ms.
One important fact: while this is running, I’m running some CPU-intensive jobs in background and the board is receiving a ping flood from another host.
See that when the task is running with real-time priority, it doesn’t matter there’s a hugger job in background or someone is trying to take your board down with a ping flood. It’s always possible to draw a line and say it will never* go beyond that limit. In the other hand, when running with normal priority, the total time varies much more.
[caption id=”attachment_298” align=”aligncenter” width=”550”
caption=”Task running with normal priority”] [/caption]
[caption id=”attachment_299” align=”aligncenter” width=”550”
caption=”Task running with real-time
priority”] [/caption]
PS.: In the graphics above I’m using an oscilloscope made by Arnaldo Carvalho de Melo. Thanks, acme.
* Well, never is a strong word. You better test with several scenarios, workloads, etc before saying that.